HOME > 写真 > 自然・風景 > 宇宙 > 惑星
710件の写真素材が検索されました。
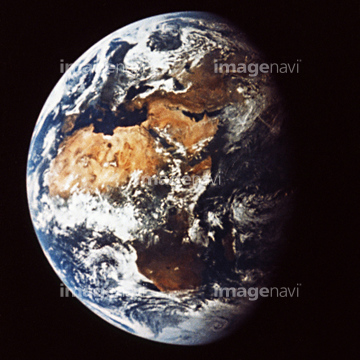
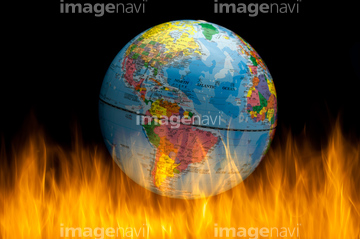
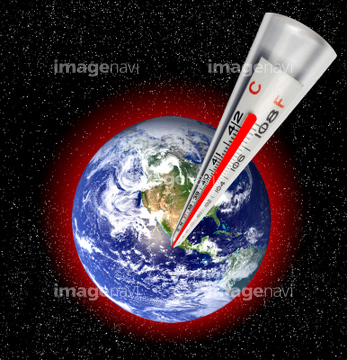
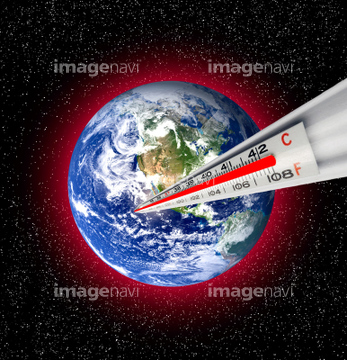
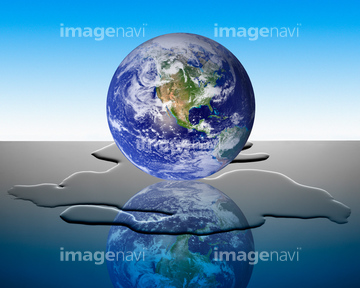
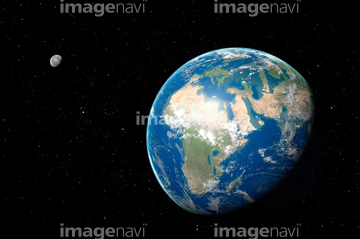
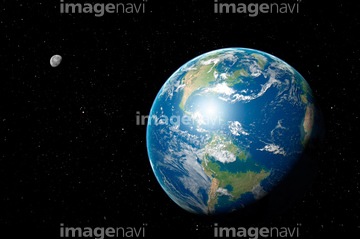
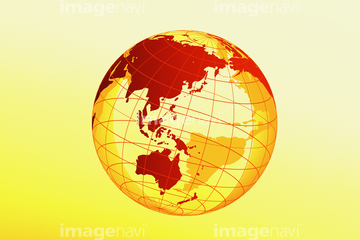
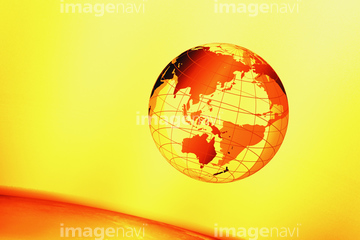
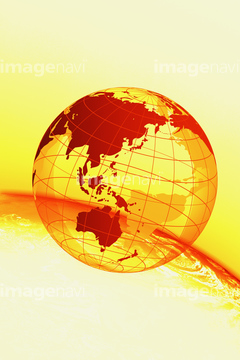
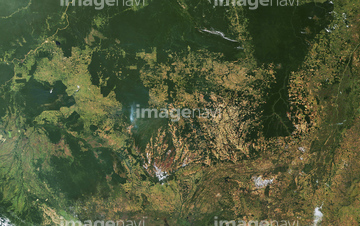
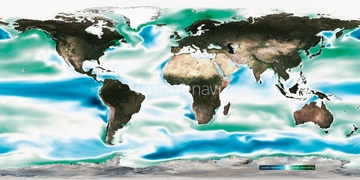
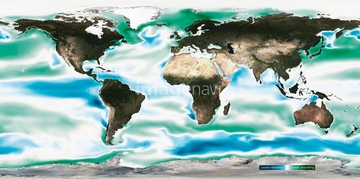
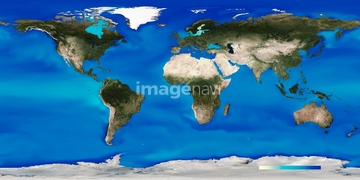
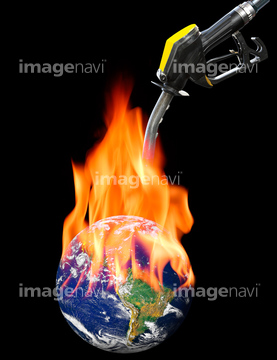
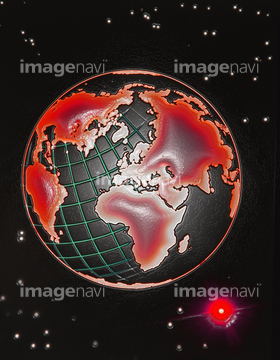
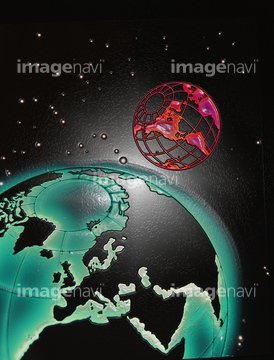
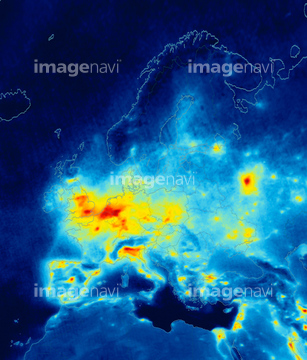
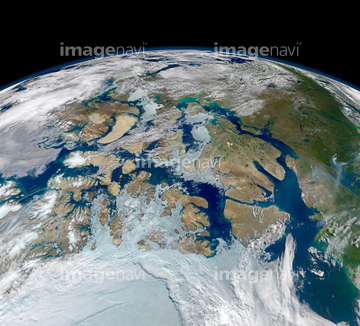
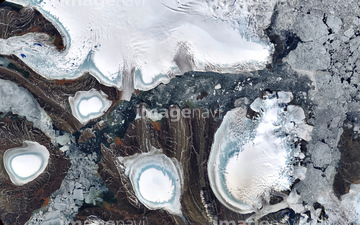
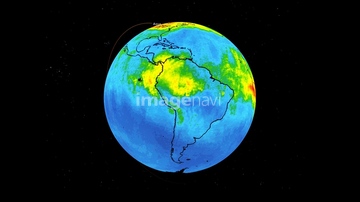
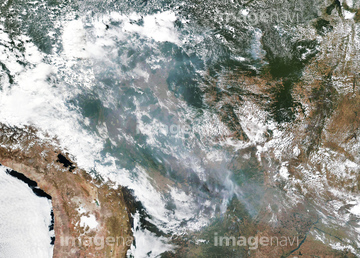
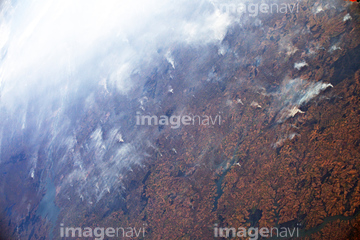
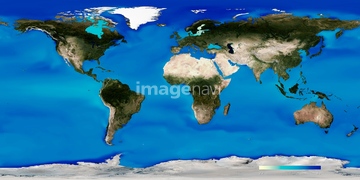
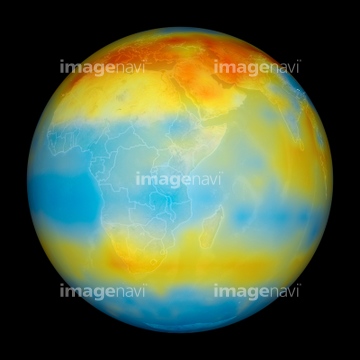
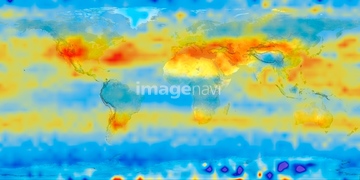
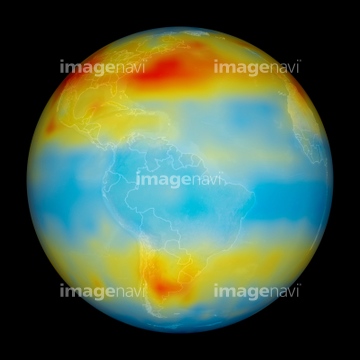
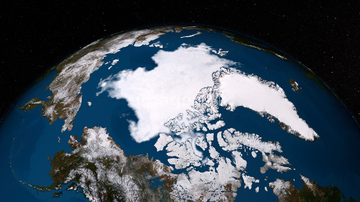
地球温暖化の写真素材は710件あります。この検索結果には、世界地図(CG)、グリーンファイナリー、宇宙から見た地球(NASA提供)、温暖化イメージ、ホッキョクグマと地球、白空間に置かれた氷に閉ざされる地球などが含まれています。
10922274
64037946
64037945
10994712
58003488

10017009
30063502
11851526
11851527
30001330
00008417
16929481

00043257
00043258
00043262
10994705
14911129
14911130
10994735
16939105
10994680
70093804
16939107
11608796
41052760
17229648
17229649
64067523
64058322
30327254
30327253
64210700
64190764

41242610
41242606
41242756

41242609
41242752
41242750

64109465

64109463

64109461

64109442
64109444

64109527

64109443
64109460

64109441

64109462

64109558

64109464
64109433

64106283
30384478
30383974
64058421
64057614
64058420
64045644
64045643

64041230

64041390
30327937
30327936
40013086
64014771
99046079
99046126
99046104
99046137
99046006
99046123
99046082
99046076
99046078
53126641
53126640
64071961
64014708
64014716
64014718
64014695
64014713
64015150
16002240
64260979
64218100
64215904
64204970
64200497

41323043
64188518
64188516
64188515
64188517
64185238
64185240
64185236
64185242
64185234
64185232
64185233
64185243
64185235
64185241
64185237
64185239
64178179
64162892
64149139
64149307
64149337
64141450

64116187
64116186
64116188
64109471
64109469

64109473

64109475
64109438

64109422
64109502

64109440

64109439
64109503
64109505
64109476
64109466

64109509
64109470
64092867

64092865
64092866
64092868
64088450
64088702
64085886
64085885
64077812
64073495
40914942
40914943
40837564
40837576
40095039
40013157
40013198
40095037
40095035
40013092
40013126
| 次ページ |